113 | Remove hero banner | Mobile

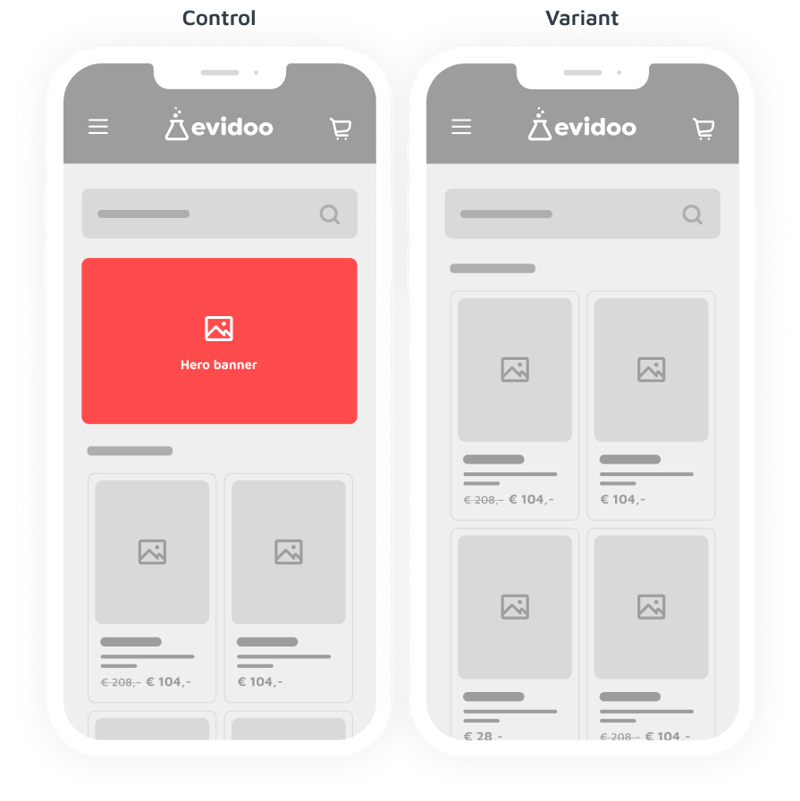
In this experiment, we tested the removal of the hero image and category banner from the product overview page on mobile devices to determine its impact on user engagement and conversion rates.
This hypothesis is grounded in the following psychological principles:
- Motivation: The presence of a large hero image and category banner may distract users from the main goal of viewing and selecting products. By removing these elements, we aim to streamline the user's journey towards product selection, thereby increasing their motivation to continue to the transaction phase.
- Attract attention: With the removal of the hero image and category banner, products are immediately visible upon landing on the product overview page. This direct exposure can capture users' attention more effectively, leading to increased engagement with the product listings.
Based on this background, we believe that removing the hero image and category banner for mobile users will cause an increase in user engagement with the product listings and a higher transaction rate.
Across all experiments, removing the hero banner led to an uplift in transactions.
Removing the hero section helps streamline the browsing experience. Users are directly exposed to products, which can speed up product discovery and reduce bounce rates. Especially on mobile, where space is limited, reducing non-essential elements proves valuable.
Possible explanations why the impact was not as hypothesized:
- Users may expect visual guidance: A hero banner can serve as orientation, and without it, some users may feel lost.
- The banner might convey promotions: If key offers are removed with the banner, it could reduce motivation.
- The page may look too plain: Some users may interpret the minimalist page as low-value or untrustworthy.
All A/B tests in Evidoo have been analysed using Bayesian Statistics. The most important advantage of Bayesian statistics is that it is easy to understand. If there is a difference between the control and the variant, we determine the probability that there is a difference. The probability that the variation differs from the control, is indicated in a percentage.
An A/B test labeled as ">80%" (winner), indicates that the hypothesis has a high probability (>80%) of being true.
An A/B test labeled as "21 - 79%" (inconclusive), suggests the hypothesis has an intermediate chance of being true. This probability range indicates that there is still uncertainty regarding the hypothesis. Therefore it can not be clearly categorized as true or false.
An A/B test labeled as "< 20%" (loser), likely represents a hypothesis that has less than a 20% chance of being true. This suggests that the hypothesis is likely false.
If the primairy KPI is ‘transactions’, there is no impact on average order value, unless mentioned in the learnings.
All A/B tests in Evidoo are also analysed on secondary KPIs, for example 'add to carts'. If we found remarkable results on other KPI’s, check the tab 'learnings'. We also analysed different segments, for example 'new visitors' or 'returning visitors'. If we found remarkable results on specific segments, check also the tab 'learnings'.
All conducted A/B tests in Evidoo comply with:
- conducting sample size and power checks.
- performing the experiment only after an A/A test has been completed.
- implementing Sample Ratio Mismatch (SRM) checks.
- maintaining a minimum runtime of 2 weeks.
- measuring A/B tests only when they are visible to the website visitor, such as counting an A/B test in the middle of the product page only if the visitor has scrolled to that point.